Your Guide to the Singles Scene, Love Life, and Modern Romance in South Florida
Miami Gardens, Florida's largest predominantly African-American city, offers a unique dating landscape shaped by its diverse population of over 117,000 residents, vibrant Caribbean culture, and proximity to Miami's world-famous social scene. Whether you're single and ready to mingle or seeking to strengthen your existing relationship, understanding the local and national dating trends can help you navigate modern romance in South Florida.
Miami Gardens Demographics & Dating Pool
Miami Gardens presents a distinctive dating environment compared to the broader Miami metropolitan area. The city's demographics create unique opportunities for singles looking to connect:
117,355
Current population (growing at 1.02% annually)
Population Breakdown
✓ Median age: 38.1 years
✓ Male median age: 36.5 years
✓ Female median age: 40 years
✓ Gender ratio: 95.6 males per 100 females
Economic Profile
✓ Median household income: $60,979
✓ Average per capita income: $36,008
✓ Average household income: $76,120
✓ Working & middle-class community
The Greater Miami Dating Scene
As part of the Miami-Dade County metro area, Miami Gardens residents benefit from access to one of Florida's most active dating markets. Miami proper boasts over 450,000 residents, with approximately 37% of the total population actively looking for a partner. The region's multicultural makeup, year-round sunshine, and legendary nightlife create countless opportunities for singles to meet.
Why Miami's Dating Scene Stands Out
Cultural Diversity: Miami's melting pot attracts people from across the Caribbean, Latin America, and beyond
Beach Lifestyle: Year-round warm weather encourages outdoor dates and social activities
Lower Marriage Rate: Miami has a below-average marriage rate compared to national statistics, meaning more singles in the dating pool
Vibrant Nightlife: World-class restaurants, clubs, and entertainment venues provide endless date options
National Dating & Relationship Trends: What the Data Shows
The "Sex Recession": A National Trend
Recent research reveals a striking decline in sexual activity across the United States. Americans are having significantly less sex than previous generations, with implications for relationships, mental health, and overall wellbeing.
How Often Are Americans Having Sex?
According to comprehensive studies from the Institute for Family Studies and the General Social Survey, sexual frequency has declined dramatically over the past three decades:
37%
Percentage of adults aged 18-64 having sex weekly in 2024
(Down from 55% in 1990 - a 33% decline)
Age Group
Average Times Per Year
Weekly Sexual Activity
18-29 years
80-112 times/year
Approx. twice per week
30-39 years
86 times/year
Once every 4-5 days
40-49 years
69 times/year
Once per week or less
60+ years
20 times/year
Less than once every 2 weeks
Sources: Kinsey Institute, Psychology Today, General Social Survey 2024
Young Adults Are Having the Least Sex
Contrary to popular assumptions, younger Americans are experiencing the steepest declines in sexual activity. Between 2000 and 2018, sexual inactivity among young men aged 18-24 more than doubled from 14.1% to 30.9%. Among women in the same age group, it increased from 8.5% to 19.1%.
Key Findings from Recent Research
Weekly sexual activity among men aged 18-24 dropped from 51.8% to 37.4% between 2000-2018
Men aged 25-34 saw weekly frequency decline from 65.3% to 50.3%
The proportion of young adults (18-29) reporting no sex in the past year reached 24% in 2024, double the 12% rate in 2010
Even married couples are affected: weekly sexual activity among married adults declined from 59% to 49%
Why Are Americans Having Less Sex?
Researchers have identified several factors contributing to the decline in sexual activity:
Social Factors
Declining face-to-face interaction (time with friends dropped 50% from 2010-2019)
Lower partnership rates (32% of 18-29 year-olds live with a partner, down from 42% in 2014)
Increased loneliness (50% of Americans experience measurable loneliness)
Delayed marriage and relationship formation
Technology & Lifestyle
Increased screen time (adolescents average 9 hours daily)
Online dating app fatigue and choice paralysis
Digital entertainment alternatives
Economic stress and time pressure
State-by-State Sexual Frequency: Where Does Florida Rank?
According to the 2023 NapLab survey of 1,567 Americans across all 50 states, there's significant variation in reported sexual frequency:
🌴 Florida Ranks #17 Nationally
1.213 times per week
Slightly above the national average of 1.064 times per week
Florida residents report having sex approximately 63 times per year
What This Means for Miami Gardens
As part of Florida, Miami Gardens residents are likely experiencing sexual frequency patterns similar to the state average. At 1.213 times per week, Florida performs better than 33 other states and ranks in the top third nationally.
📊 Interactive State Rankings Visualization
Top 10 States + Florida (Times Per Week)
#1 Alaska
2.81
#2 New Mexico
2.06
#3 Vermont
1.70
#4 Arkansas
1.67
#5 Indiana
1.53
#6 Hawaii
1.51
#7 Oregon
1.47
#8 Massachusetts
1.46
#9 New York
1.39
#10 New Hampshire
1.35
🌴 #17 FLORIDA
1.21
Bars animate on page load. Data normalized with Alaska (2.81) as 100%.
🔍 Complete State Rankings: All 50 States (Searchable)
Rank
State
Per Week
Per Year
1
Alaska
2.81
146
2
New Mexico
2.06
107
3
Vermont
1.70
88
4
Arkansas
1.67
87
5
Indiana
1.53
80
6
Hawaii
1.51
79
7
Oregon
1.47
77
8
Massachusetts
1.46
76
9
New York
1.39
72
10
New Hampshire
1.35
70
11
Minnesota
1.34
70
12
Wyoming
1.34
70
13
Utah
1.28
67
14
South Carolina
1.27
66
15
Iowa
1.23
64
16
Alabama
1.22
64
17
🌴 FLORIDA
1.21
63
18
New Jersey
1.21
63
19
South Dakota
1.14
59
20
Kentucky
1.10
57
21
Montana
1.10
57
22
Virginia
1.10
57
23
North Dakota
1.09
57
24
Connecticut
1.08
56
📊 NATIONAL AVERAGE: 1.06/week (55/year)
25
Nevada
1.02
53
26
Missouri
1.00
52
27
Georgia
1.00
52
28
Louisiana
0.99
51
29
Arizona
0.98
51
30
California
0.93
48
31
Washington
0.90
47
32
Ohio
0.90
47
33
Texas
0.86
45
34
Maryland
0.86
45
35
Mississippi
0.85
44
36
Rhode Island
0.83
43
37
Kansas
0.80
42
38
Oklahoma
0.79
41
39
Pennsylvania
0.79
41
40
Illinois
0.75
39
41
North Carolina
0.74
38
42
Tennessee
0.73
38
43
Delaware
0.69
36
44
Wisconsin
0.66
34
45
Idaho
0.65
34
46
West Virginia
0.64
33
47
Nebraska
0.55
29
48
Michigan
0.51
27
49
Maine
0.50
26
50
Colorado
0.42
22
Source: NapLab 2023 Survey of 1,567 Americans
Important Context About State Rankings
Federal health agencies like the CDC and Census Bureau don't publish state-level sexual frequency data due to confidentiality concerns and sample size requirements. The NapLab survey is currently the only publicly available state-level data, but it has methodological limitations including small sample sizes, self-selection bias, and lack of demographic controls.
Relationship Quality Matters More Than Quantity
While frequency statistics are interesting, recent research from the Singles in America 2025 survey emphasizes that modern daters are increasingly prioritizing quality over quantity.
Emotional Connection
Mental health compatibility
Shared values and life goals
Open communication about boundaries
Emotional intimacy and vulnerability
Relationship Benefits
51% feel healthier when sexually satisfied
51% report greater confidence
65% feel happier overall
Regular intimacy strengthens pair bonds
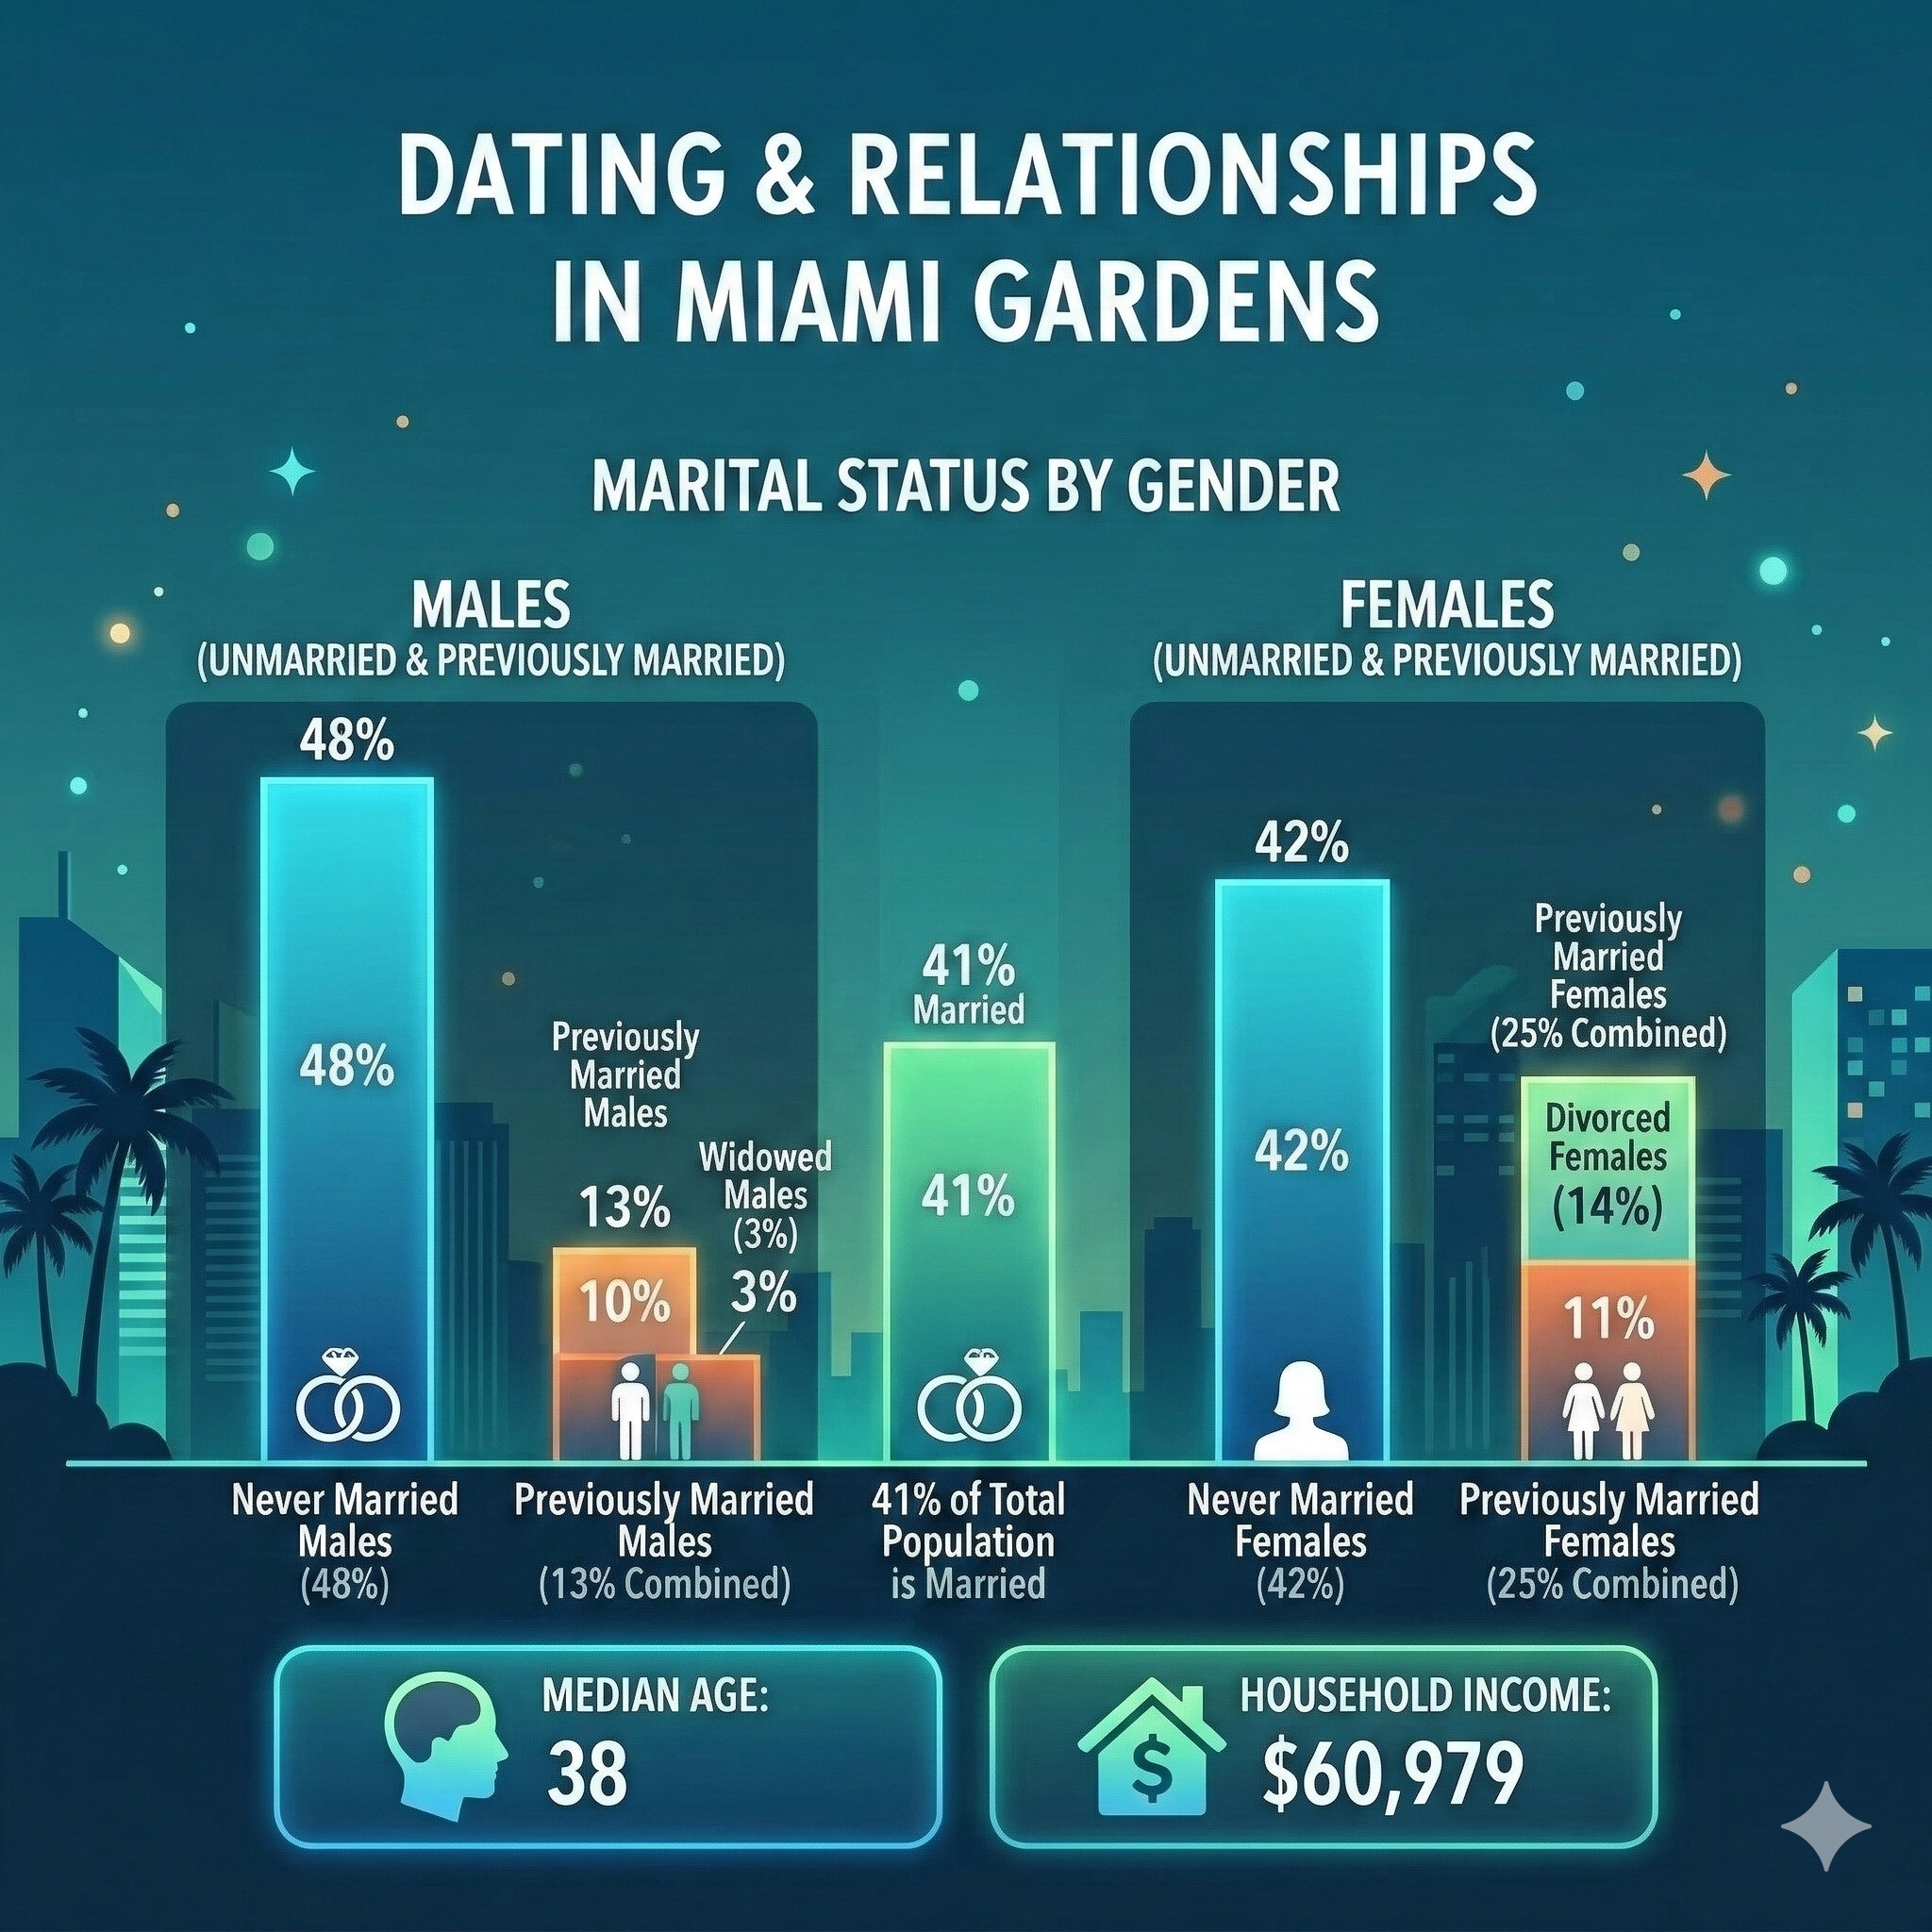
Marriage, Divorce & Birth Rates: Miami Gardens by the Numbers
Understanding marriage, divorce, and birth rate statistics provides insight into family formation patterns and relationship stability in Miami Gardens and the broader South Florida community.
Marriage Rates in Miami Gardens
30.9%
Miami Gardens residents aged 15+ who are married
(69.1% are single, separated, divorced, or widowed)
Miami Gardens has a notably higher proportion of single residents compared to the national average. Only 30.9% of the population aged 15 and older is currently married, meaning approximately 69.1% of Miami Gardens residents are single — whether never married, separated, divorced, or widowed.
What This Means for Singles
With nearly 70% of the adult population unmarried, Miami Gardens offers a robust dating pool for singles. This demographic reality creates a dynamic social environment where meeting other singles is statistically more likely than in cities with higher marriage rates. The city's demographics favor active dating and relationship-building, particularly for those in their 30s and 40s (the city's median age is 38.1 years).
Florida Context
Florida has one of the 10 lowest marriage rates in the U.S.
Men in Florida marry at age ~30.4 years (national median)
Women in Florida marry at age ~28.5 years (national median)
Miami-Dade County mirrors statewide trends with below-average marriage rates
Marital Status Breakdown (Miami Gardens)
30.9% Currently married
~45-50% Never married (estimated)
~10-15% Divorced (estimated)
~5-8% Widowed or separated (estimated)
Divorce Rates in Florida
While specific divorce data for Miami Gardens alone is not readily available, Florida state-level statistics provide important context for South Florida residents:
Key Florida Divorce Trends
Declining Divorce Rates: Florida has seen a 24.4% decrease in divorce rates from 2011 to 2021
National Context: Approximately 50% of first marriages in the U.S. end in divorce
Subsequent Marriages: Second marriages have a 60% divorce rate; third marriages face 73% divorce rates
Florida Ranking: Florida ranks among the top 10 states for divorce rates, though rates have been declining over the past decade
Delayed Marriage: People marrying later in life (late 20s/early 30s) tend to have more stable relationships
Economic Factors: Divorce can be expensive; financial pressures sometimes keep couples together
Cultural Shifts: More couples living together before marriage, better vetting of compatibility
Lower Marriage Rates: Fewer people getting married overall means fewer divorces statistically
Birth Rates & Fertility Trends
Miami-Dade County Fertility Rate
57.8
births per 1,000 women aged 15-44 (2023)
Above Florida's state average of 53.9 per 1,000 women
Miami Gardens, as part of Miami-Dade County, experiences birth rate patterns that exceed both the Florida state average and reflect the county's diverse, younger population base.
Miami-Dade County (2023)
29,516 total live births
57.8 fertility rate per 1,000 women (ages 15-44)
67.5% of births were Hispanic
16.1% of births were Black
14.6% of births were White
Florida Statewide (2023)
221,410 total live births
53.9 fertility rate per 1,000 women (ages 15-44)
33.3% of births were Hispanic
20.9% of births were Black
41.2% of births were White
Miami Gardens Birth Rate Context
According to U.S. Census data, 6.5% of women aged 15-50 in Miami Gardens gave birth in the past year — approximately 1.3 times the rate for both Miami-Dade County (4.9%) and Florida overall (5.1%). This higher birth rate suggests:
A relatively younger, family-oriented population
Strong community and family support structures
Higher fertility among Miami Gardens' predominantly Black and Hispanic population
Potential for dating opportunities among young families and single parents
Declining Fertility: A National Trend
Like the broader "sex recession," birth rates have been steadily declining across the United States. Florida's fertility rate has dropped from 71.0 per 1,000 women in 1990 to 53.9 in 2023 — a 24% decline over three decades.
Year
Florida Fertility Rate
Trend
1990
71.0 per 1,000 women
Peak fertility
1999
62.0 per 1,000 women
12.7% decline
2012
59.3 per 1,000 women
Continued decline
2020
53.4 per 1,000 women
Pandemic impact
2023
53.9 per 1,000 women
Slight stabilization
Source: March of Dimes PeriStats, Florida Health CHARTS 2024
Why Fertility Rates Matter for Dating
Lower fertility rates often correlate with delayed family formation, meaning more singles in the dating pool longer
Economic pressures, career focus, and student debt contribute to delayed childbearing
Miami Gardens' higher-than-average birth rate suggests a community where family formation is valued
Dating in your 30s and 40s in Miami Gardens often involves navigating blended families and co-parenting dynamics
Local Date Ideas in Miami Gardens & Surrounding Areas
Miami Gardens' location provides access to both local venues and the broader Miami dating scene:
Hard Rock Stadium
Catch a Dolphins game, concert, or major event. Perfect for sports-loving couples.
Calder Casino
Entertainment, dining, and gaming for an exciting night out.
Rolling Oaks Park
Casual outdoor setting for picnics and walks.
Caribbean Restaurants
Experience authentic Caribbean cuisine.
South Beach (25 min)
Classic Miami beach experience and Art Deco architecture.
Wynwood Walls (20 min)
Explore street art, galleries, and trendy cafes.
Aventura Mall (15 min)
Upscale shopping and dining experience.
Vizcaya Museum (30 min)
Romantic waterfront estate with stunning gardens.
Dating Challenges in South Florida
Common Dating Obstacles
The "Grass is Greener" Mentality: With constant newcomers and abundant options, some daters struggle with commitment
Geographic Spread: Miami is not highly walkable, and traffic can make cross-town dating challenging
Cost of Living: Miami's high living costs can impact dating budgets
Fast-Paced Lifestyle: Career focus and busy schedules can make relationship-building difficult
Transient Population: Many residents are temporary, which can affect relationship stability
Strategies for Success
Tips for Miami Gardens Singles
Develop strong local social circles through community events
Be open to both online and offline meeting methods
Take advantage of year-round outdoor activities
Attend cultural festivals celebrating Caribbean and African-American heritage
Consider expanding your geographic range within Miami-Dade County
Focus on building genuine connections rather than collecting matches
The Role of Technology in Modern Dating
Online Dating Statistics
52% of app users employ them to find dating partners
41% seek long-term partners through apps
29% use apps specifically for casual encounters
Increased screen time correlates with decreased in-person social interaction
While apps provide access to larger dating pools, they can also create unrealistic expectations and fatigue. Successful daters often blend both online and offline strategies.
Key Takeaways for Miami Gardens Singles
Understanding Your Local Dating Landscape
Miami Gardens' 117,000+ residents provide a solid local dating pool
The city's median age of 38 aligns with peak dating and relationship-building years
69.1% of Miami Gardens residents are single, creating a robust dating market
Higher-than-average birth rates suggest a family-oriented community
National trends show declining sexual frequency, but quality of connection matters more than quantity
Emotional intimacy and shared values increasingly trump physical attraction alone
South Florida's year-round sunshine and cultural diversity create unique dating advantages
Success requires balancing online tools with in-person connections
Sources & Research
This comprehensive guide draws from multiple authoritative sources:
NapLab 2023 Survey on Sexual Frequency by State (1,567 respondents)
Institute for Family Studies - "The Sex Recession" reports (2024)
General Social Survey (GSS) - NORC at the University of Chicago (2024)
JAMA Network Open - "Trends in Frequency of Sexual Activity 2000-2018"
Singles in America 2025 Survey (5,000 U.S. singles)
Kinsey Institute Sexual Behavior Research
CDC National Survey of Family Growth (NSFG)
U.S. Census Bureau - Miami Gardens Demographics 2023-2025
March of Dimes PeriStats - Fertility & Birth Data (2023)
Florida Health CHARTS - Birth Dashboard (2024)
Statistical Atlas - Marital Status Data
Divorce.com - Florida Divorce Statistics (2024)
Troy Legal P.A. - Florida Family Law Data
Discover More About Miami Gardens
Explore our comprehensive guides to living, working, and thriving in Miami Gardens, Florida
 87°
87°